A better blueprint for greener infrastructure
30.03.21
| 2 min read
Author: Katie Dawson, GIS analyst and researcher, MSc, FRGS, CGeog(GIS)
As the long awaited Environment Bill makes its way through the House of Commons, many organisations and local authorities are preparing for the proposed Biodiversity Net Gain (BNG) mandatory requirement. When the Bill is passed, any new infrastructure or building project regulated under the Town and Country Planning Act must increase biodiversity by 10%. But calculating and weighing up all the data, options and costs associated with managing biodiversity for a site is notoriously difficult and time consuming. If not managed effectively, it can impact programme delivery certainty.
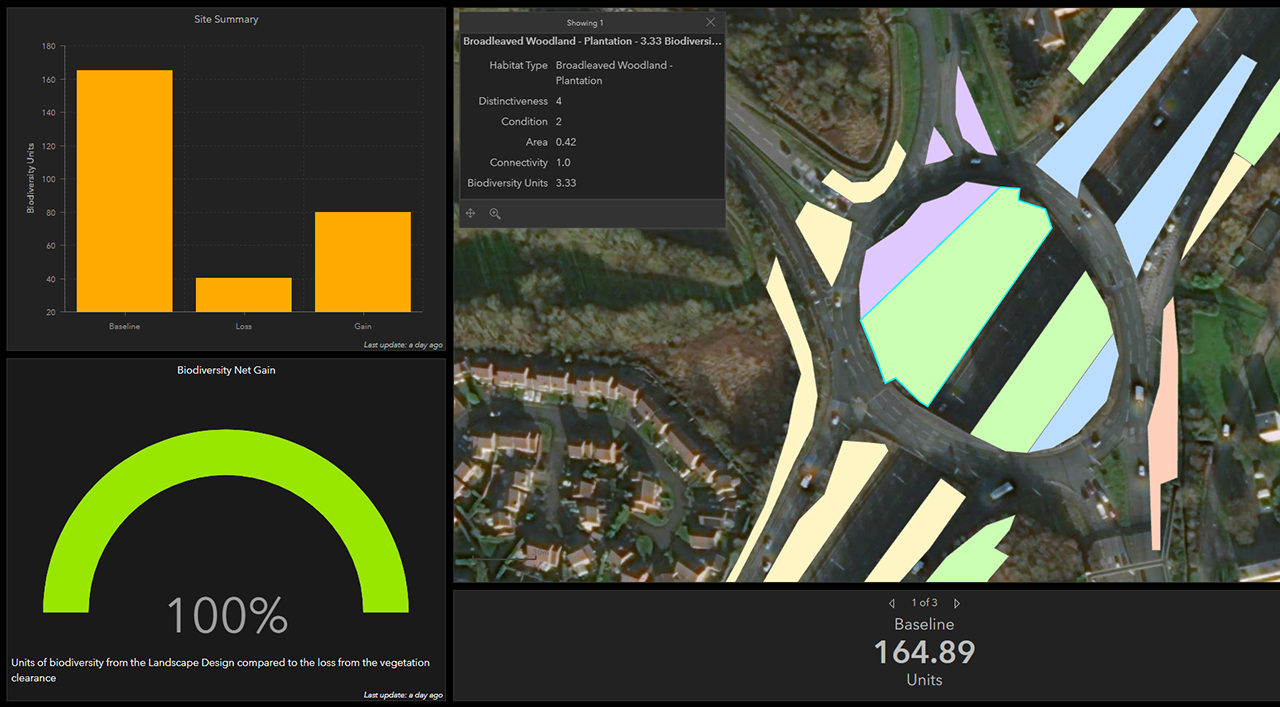
To calculate biodiversity losses and gains, planning applications will need to use DEFRA’s Biodiversity Metric 2.0. This metric requires information on habitat distinctiveness, condition and connectivity to give an overall indicative score – known as ‘biodiversity units’ – for the biodiversity quality of the site being built on. If companies cannot demonstrate they can meet the 10% requirement on the selected site, they will then need to fund the generation of equivalent biodiversity units elsewhere to make up the shortfall.
As part of an engineering doctoral collaboration with the University of Reading, Costain has developed the Digital Biodiversity Management (DBM) capability. This leverages powerful geographic information systems (GIS) technology, which is often used to capture, manage, and help people visualise location data, into a comprehensive analysis and decision-making tool that allows us to plan in cost effective BNG.
There's more than meets the eye

Start gathering data early
The optimal time to consider biodiversity is early in the design phase so it’s important to invest early in data capture and GIS. This phase is particularly crucial for adding concepts that reduce impacts to the environment such as habitat loss, pollution, and waste production. It’s also a good time to explore options to include habitats that are a carbon sink and increase sequestered carbon, for example woodlands and peat bogs. It is in this phase that the cost of changes is the lowest, making it the best phase for realising aspirations and adding value to the project.
Having all the data at our fingertips on the ‘biodiversity units’ of the project site enables us to more easily cost and plan BNG into the programme, giving our clients greater certainty of delivery and of achieving, or even exceeding, the BNG requirement. Even if there are iterations of the design, being able to interrogate the data and explore the impact of changes quickly, makes for rapid decisions on cost effective and environmentally beneficial choices.
We use open-source data to locate statutory conservation constraints such as national parks or a Site of Special Scientific Interest (SSSI), local planning authorities, and identifying land-use and land-cover types. We use these land-cover types to identify the characteristics of, and risk to, each habitat. Clients can be shown DEFRA metric factors as well as two different risk factors we’ve built into the tool. The ‘time to maturity’ risk factor reduces what it’s worth based on how many years it’s going to take to be established. The ‘difficulty of creation’ risk factor covers how hard it will be to create. For example, it’s harder to create a wetland (because you need particular soil types, particular drainage and water) than it is to sow some grass seed.
Better data, better decisions
All of these factors help easily locate areas of high value that would be best to avoid changing as well as those with a lower rating where we can suggest opportunities for biodiversity enhancement, adding a lot more detail and geographical context that you can with an excel file. We can provide clients with a better understanding of the time and cost associated with offsetting the impact of any work in minutes. For example, we can provide clients with a series of options on seed mixes that give an 11%, 17% or 23% gain in biodiversity, and illustrate the respective costs to plant and maintain each mix. This insight means they can make informed decisions about how to allocate their funds for habitat enhancement.
We can provide clients with a series of options on seed mixes that give an 11%, 17% or 23% gain in biodiversity, and illustrate the respective costs to plant and maintain each mix.
This methodology enables efficient and robust data management - we know exactly what data sets we have, what format they are in, where they are stored for handover and how to visualise them. Data is easily shared in whatever format is compatible with the client’s or designer’s files. We can import design drawing files into a GIS format or export GIS shapefiles showing the baseline provided by the environmental surveys into a CAD format that can then be sent to designers. If we begin a project with an existing landscape design, through our own inhouse ecology team we can make the landscape data set compatible with the DEFRA metric.
Data to prove delivery of BNG
Good data management also helps to accurately and easily demonstrate that BNG has been achieved. As part of our GIS capability, we have field surveying applications so an environmental or ecological surveyor can go into the field with a hand-held mobile device, click on the polygon that represents the area visited (or scanned by a drone) and input answers to questions such as – is this being maintained, is the BNG being delivered? And add notes if signs of a badger or a great crested newt are detected. Costain is also drawing on its experience in UAVs and photogrammetry to improve the quality and efficiency of data collection.
This GIS integration saves time for ecologists and environmental managers. With just a few clicks of a button and a few minutes of processing, official biodiversity unit calculations can be reported accurately. The other great thing about GIS is that as the metrics change the data is completely adaptable. We can change what our inputs are, the methodology stays the same. Each time we do a project, data is added and helps us to share lessons learned and opportunities to enhance biodiversity from project to project.
Digital Biodiversity Management (DBM) provides efficient biodiversity management which improves programme delivery certainty, helps reduce biodiversity losses and optimises opportunities for greater net gain. This means greener infrastructure for our planet and communities.
This is just one way Costain is shaping a better blueprint for infrastructure programmes that leverages the power of meaningful data and the benefits of digital technologies.
Find out more about our GIS capability and join the #CostainBlueprint conversation.
About the author
Katie Dawson is a GIS Analyst and researcher affiliated with Costain for seven years, undertaking award-winning doctoral GIS research to promote environmental sustainability in the large infrastructure industry. Her technical expertise includes the proficient use desktop and online GIS platforms, spatial data management, spatial analysis, and visualisation.
The doctorate is part of Costain’s research, development and innovation programme and is testament to Costain’s commitment to be a clean growth leader, outlined in our Climate Change Action Plan launched in February 2020.
Related

 3 min
3 min

3 min
Road, Rail, Water, Aviation, Energy, Defence and Nuclear energy